What's your GitHub Actions carbon footprint?
Estimate the carbon footprint of your workflows by runner type, duration, and location. Discover your CO₂, kWh, and cost — and see how much you save by switching to CarbonRunner.
Yes, your GitHub Actions have a carbon footprint
Every workflow runs on a real server in a real data centre. Each server burns through CPU minutes to build, test, and ship software, drawing electricity from the grid. The carbon emitted depends on where and when that power is generated, what's known as grid intensity. On GitHub's shared runners, that intensity averages over 300 gCO₂/kWh.
One job might be tiny, but with 16 million jobs running every day, GitHub's footprint adds up fast. In 2024 alone, developers consumed 10.54 billion GitHub Actions minutes, a 30% increase year-on-year. At current grid intensities, that workload produces around 90% more emissions than the same jobs running with CarbonRunner.
How can I find my Actions Usage Metrics?
It's a few simple steps you find your GitHub Actions metrics.
Follow the few steps below or head to GitHub's documentation.
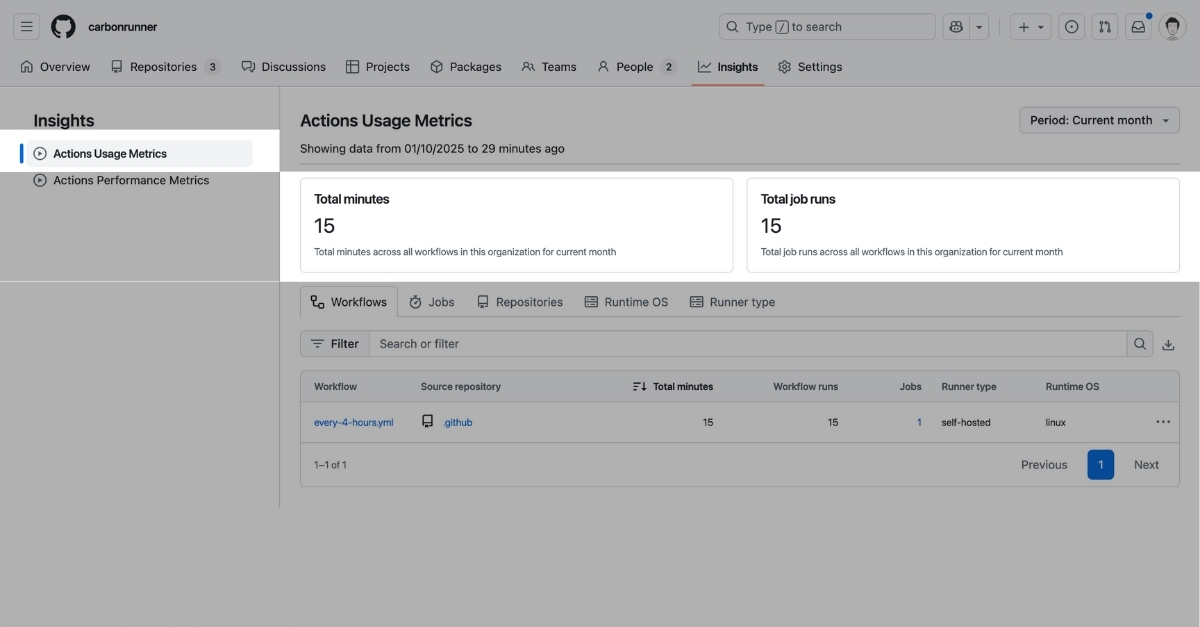
Visit your GitHub organisation profile and click on "Insights" tab.

Click "Actions Usage Metrics" in the menu on the left hand side. This will show you your total minutes and total job runs.
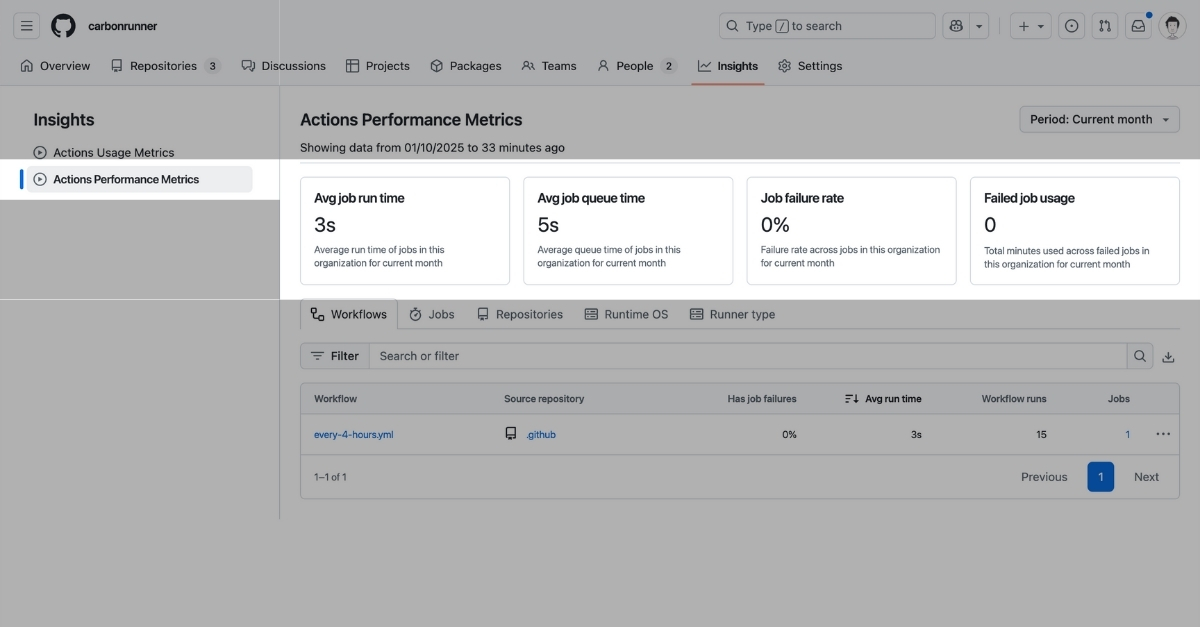
Click "Actions Performance Metrics" in the menu on the left hand side. Will show you your average jon run time which is all needed for our calculator.
If you're on a GitHub free account you'll get 2,000 free monthly minutes. If you're on a Pro or Team it's 3,000 free minutes and Enterprise is 50,000 free minutes.
Free minute matching
Free minutes aren't free if they cost the planet. So we will match all free minutes on GitHub.
How Do You Know What GitHub's Emissions Are?
CarbonRunner estimates GitHub's emissions by running small, lightweight jobs directly on GitHub-hosted runners. From inside the job, we query the instance metadata service, which reveals the cloud provider region the job is running in.
The line graph below compares the global average carbon intensity with GitHub's average across all their cloud regions, and with our carbon-aware cloud approach.
"Today, electricity consumption from data centres is estimated to amount to around 415 terawatt hours (TWh), or about 1.5% of global electricity consumption in 2024."
How is using CarbonRunner different?
CarbonRunner intelligently routes your jobs to the lowest-CO₂ regions across AWS, Azure, and GCP — in real time. By keeping every workload under 100g CO₂e/kWh, we cut emissions by up to 90% compared to running in default regions.
How is this estimate calculated?
We factor in grid intensity, CPU and hardware used for standard GitHub jobs. This does not currently include embodied carbon or network transfer and storage. We're working on adding these.
⚡️ Ready to supercharge your GitHub Actions?
Not only is this good for planet, it's great for business too.