The World's Most Sustainable Workloads — With 90% Less Carbon Emissions
CarbonRunner helps you run jobs where grids are cleanest and water stress is lowest.
33g
CO2eq/kWh
The average grid intensity of CarbonRunner
287g
CO2eq/kWh
GitHub's average CO2 intensity.
Finding the Lowest-CO₂ Regions in Real Time
CarbonRunner intelligently routes your jobs to the lowest-CO₂ regions across AWS, Azure, and GCP — in real time. By keeping every workload under 100g CO₂e/kWh, we cut emissions by up to 90% compared to running in default regions.
The result: your GitHub Actions and AI training run faster, cheaper, and dramatically greener, with just a single line of code change.
By consuming live grid energy data — CarbonRunner can shift workloads to regions with the cleanest energy in real time.
And where more granular data is available, we take that in too. All of it feeds into our dynamic weighting system, which continuously balances carbon intensity, cost, and performance to place your jobs in the lowest-CO₂ regions possible.
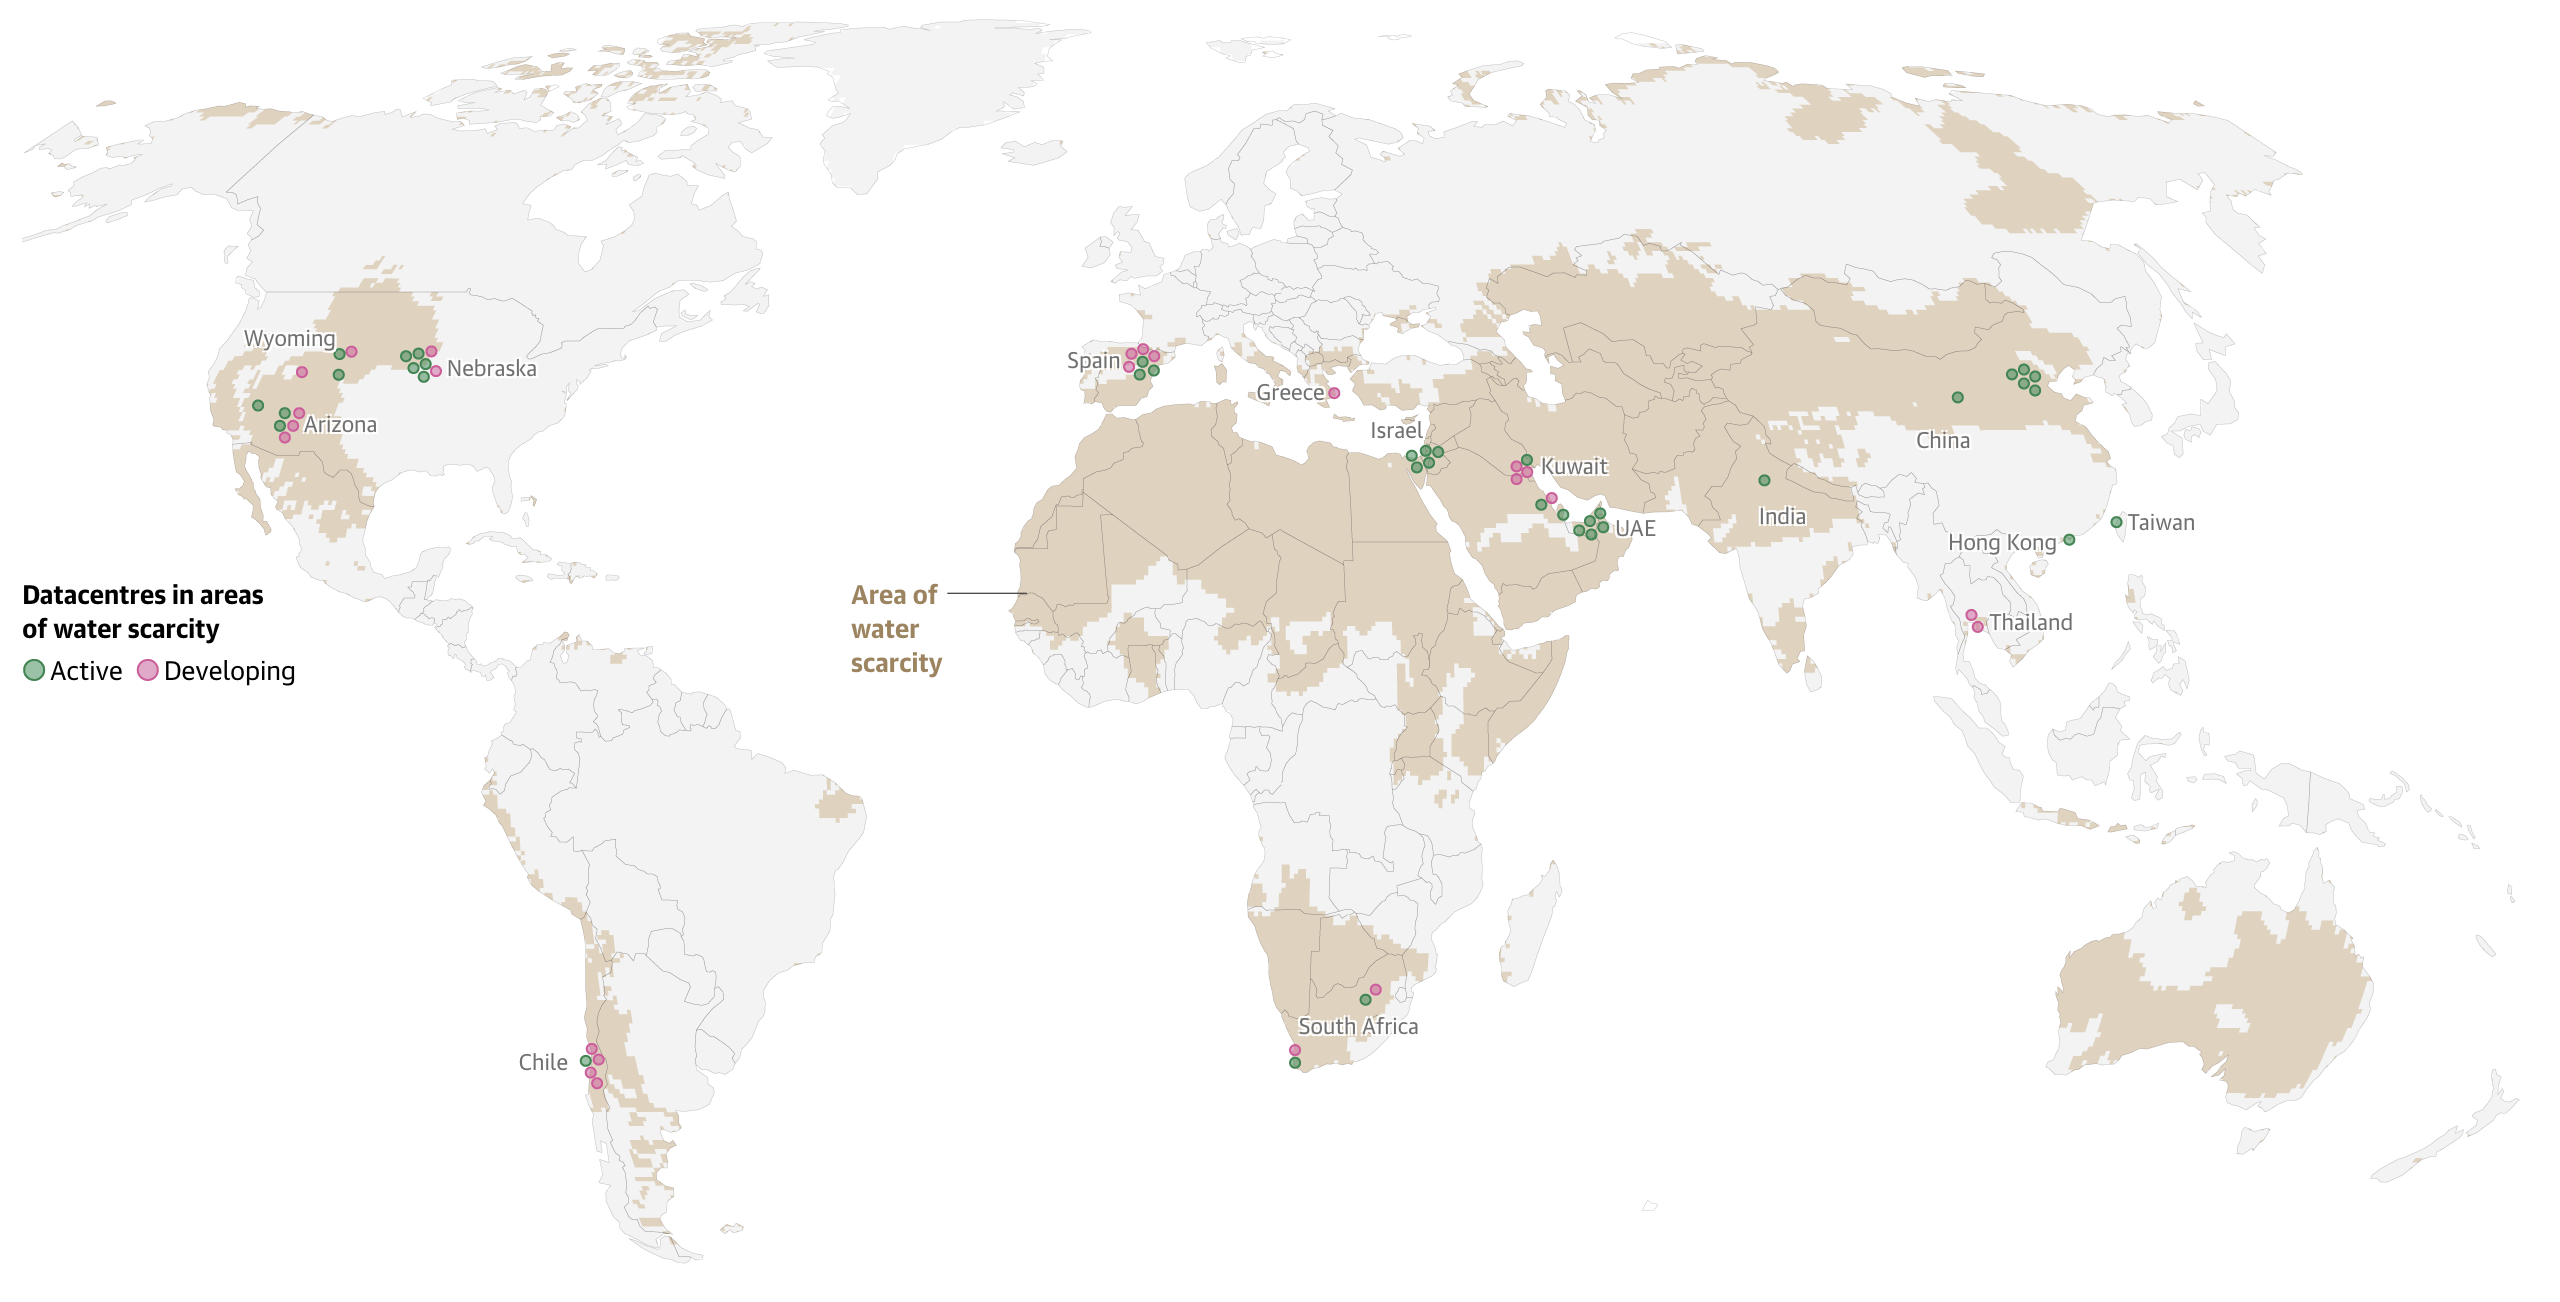
How Do You Find Data Centers in Water-Stressed Regions?
Did you know?
We’ve turned off the Querétaro, Mexico regions on Azure, AWS, and GCP to help reduce pressure on local water-scarce areas—workflows now shift automatically to other less impactful regions.
We overlay global data center maps with water scarcity datasets — including the World Water Map and investigative reporting such asThe Guardian’s coverage of drought-prone areas. Where available, we also incorporate operator-reported Water Usage Effectiveness (WUE) to refine the picture.
How Do You Know What GitHub's Emissions Are?
By leveraging multiple cloud providers, we automatically start instances in the lowest-carbon regions with a grid intensity below 100 g CO₂e/kWh.
The line graph below compares the global average carbon intensity with GitHub's average across all their cloud regions, and with our carbon-aware cloud approach.
World intensity
GitHub intensity
CarbonRunner intensity
How do you know what GitHub's emissions are?
CarbonRunner estimates GitHub’s emissions by running small, lightweight jobs directly on GitHub-hosted runners. From inside the job, we query the instance metadata service, which reveals the cloud provider region the job is running in.
Once we know the region, we cross-reference it with live electricity grid data to calculate the carbon intensity at the exact time the job ran. By combining runtime location with real-time grid data, we can build a transparent picture of the emissions from GitHub’s default runners — and show how CarbonRunner improves on that baseline.
GitHub Actions are slow, expensive and are powered by fossil fuels.
Every build you run on GitHub-hosted runners comes at a premium — both in cost and emissions. Most workloads run on fossil-fuel heavy grids, and the waste adds up fast.
436g
CO2eq/kWh
The current global grid intensity average.
Full of lots of fossil fuels.
287g
CO2eq/kWh
The current average grid intensity of Github runners.
Where over 10 million jobs are run each day.
Fun fact... right now CarbonRunner is a whopping 9x greener than default GitHub Actions.
33g
CO2eq/kWh
The average grid intensity of CarbonRunner
The world's first carbon-aware CI/CD infrastructure.
The world’s first carbon-aware CI/CD platform
Redefining what CI/CD should be
Not just faster builds. Not just lower costs. CarbonRunner makes sustainability a core metric — tracking every gram of CO₂ saved alongside your performance. See the difference CarbonRunner makes in real time.
- Total customer CO₂eq saved
- 0kg
- Number of low-CO2 region used
- 0
- Our average g CO₂eq/kWh intensity
- 0g
- Greener than GitHub
- 0X
Keeping Your Workflows Safe & Secure
CarbonRunner secures GitHub Actions with ephemeral VMs, daily updates, GitHub SSO, and encryption built in at every layer.